For my roughly 3 regular readers of this blog, I apologize for missing last week. Life is ramping up in a big way. TEDxKyoto is now a daily presence, even as I continue to prepare for my existing teaching jobs and create a new curriculum for my upcoming Kindergarten position at Kyoto International School in the fall. And let us not forget my ongoing presence as homeschool taskmaster (taskmistress? tasklady?) for Patrick and Aya.
So, as usual, the blog gets pushed to the bottom of the pile.
Today I'd like to share my love of INFOGRAPHICS.
I love infographics.
I love the bright colors.
I love the artistry.
I love the way they encapsulate trivia and knowledge into tasty bite sized morsels.
For example, you can enjoy an infographic about Star Trek. I absolutely love this one, even though I can't read a thing on it, aside from the word "Star Trek". Doesn't matter. I love it anyway.

Or perhaps you'd like to see a rundown of how you use your brain on a daily basis.

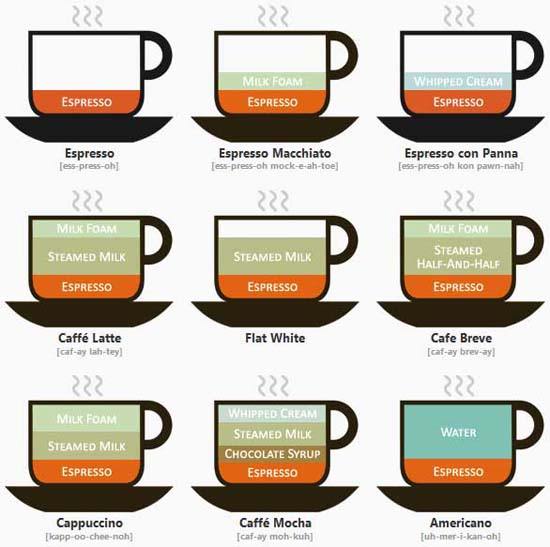
Too esoteric for you? How about a nice little coffee infographic? Mmmm. Coffee.
Then there's the odd irony of having infographics about infographics.

There are indescribably beautiful and perplexing infographics:

And my absolute favorites, the infographics that totally BLOW MY MIND:

Yet, as much as I adore all these infographics, I have to keep a cool head.
As do you.
Because, just like a kid finding something tantalizing the ground, we have to ask ourselves "do we really know where this infographic has been?" before we pick it up and use it.
Who made it?
Where did the "info" in the "graphic" come from?
In a world full of shiny apps, nifty infographics and youtube singing sensations, it is way too easy to be dazzled.
Well, except for this infographic. I'll let my self be dazzled by this one:

Until next time....
No comments:
Post a Comment